
In today’s rapidly changing and highly competitive business world, it is vital for investors and industry enthusiasts to carefully assess companies. In this article, we will perform a comprehensive industry comparison, evaluating Adobe (NASDAQ:ADBE) against its key competitors in the Software industry. By analyzing important financial metrics, market position, and growth prospects, we aim to provide valuable insights for investors and shed light on company’s performance within the industry.
Adobe Background
Adobe provides content creation, document management, and digital marketing and advertising software and services to creative professionals and marketers for creating, managing, delivering, measuring, optimizing, and engaging with compelling content multiple operating systems, devices, and media. The company operates with three segments: digital media content creation, digital experience for marketing solutions, and publishing for legacy products (less than 5% of revenue).
| Company | P/E | P/B | P/S | ROE | EBITDA (in billions) | Gross Profit (in billions) | Revenue Growth |
|---|---|---|---|---|---|---|---|
| Adobe Inc | 15.85 | 9.35 | 4.75 | 15.87% | $2.51 | $5.54 | 10.49% |
| Palantir Technologies Inc | 221.44 | 45.01 | 79.96 | 8.71% | $0.4 | $0.97 | 19.11% |
| Salesforce Inc | 25.83 | 3.02 | 4.63 | 3.44% | $3.3 | $8.0 | 8.63% |
| AppLovin Corp | 55.77 | 108.44 | 25.76 | 63.27% | $1.11 | $1.23 | 68.23% |
| Intuit Inc | 28.94 | 6.07 | 6.13 | 2.29% | $0.83 | $3.0 | 18.34% |
| Synopsys Inc | 54.21 | 2.95 | 10.27 | 1.6% | $1.16 | $1.6 | 37.83% |
| Cadence Design Systems Inc | 77.06 | 15.65 | 15.70 | 5.63% | $0.48 | $1.16 | 10.15% |
| Autodesk Inc | 47.30 | 17.85 | 7.62 | 12.23% | $0.53 | $1.69 | 18.03% |
| Datadog Inc | 418.29 | 12.18 | 13.75 | 1.02% | $0.05 | $0.71 | 28.35% |
| Workday Inc | 64.65 | 4.54 | 4.48 | 2.79% | $0.45 | $1.84 | 12.59% |
| Roper Technologies Inc | 24.57 | 1.87 | 4.78 | 2.15% | $0.82 | $1.4 | 2.04% |
| Zoom Communications Inc | 18.48 | 3.03 | 6.14 | 6.72% | $0.34 | $0.96 | 4.44% |
| PTC Inc | 23.96 | 5.04 | 6.86 | 4.34% | $0.25 | $0.57 | 21.36% |
| Trimble Inc | 39.14 | 2.81 | 4.64 | 1.94% | $0.2 | $0.62 | 2.9% |
| Tyler Technologies Inc | 50.14 | 4.31 | 6.88 | 2.33% | $0.15 | $0.28 | 9.67% |
| IREN Ltd | 29.81 | 5.67 | 16.91 | -5.77% | $-0.23 | $0.11 | 59.02% |
| Guidewire Software Inc | 125.70 | 7.39 | 9.01 | 2.09% | $0.03 | $0.21 | 26.53% |
| Average | 81.58 | 15.36 | 13.97 | 7.17% | $0.62 | $1.52 | 21.7% |
By conducting an in-depth analysis of Adobe, we can identify the following trends:
-
The Price to Earnings ratio of 15.85 is 0.19x lower than the industry average, indicating potential undervaluation for the stock.
-
The current Price to Book ratio of 9.35, which is 0.61x the industry average, is substantially lower than the industry average, indicating potential undervaluation.
-
Based on its sales performance, the stock could be deemed undervalued with a Price to Sales ratio of 4.75, which is 0.34x the industry average.
-
The Return on Equity (ROE) of 15.87% is 8.7% above the industry average, highlighting efficient use of equity to generate profits.
-
The company has higher Earnings Before Interest, Taxes, Depreciation, and Amortization (EBITDA) of $2.51 Billion, which is 4.05x above the industry average, indicating stronger profitability and robust cash flow generation.
-
The gross profit of $5.54 Billion is 3.64x above that of its industry, highlighting stronger profitability and higher earnings from its core operations.
-
The company is witnessing a substantial decline in revenue growth, with a rate of 10.49% compared to the industry average of 21.7%, which indicates a challenging sales environment.
Debt To Equity Ratio
The debt-to-equity (D/E) ratio is a measure that indicates the level of debt a company has taken on relative to the value of its assets net of liabilities.
Considering the debt-to-equity ratio in industry comparisons allows for a concise evaluation of a company’s financial health and risk profile, aiding in informed decision-making.
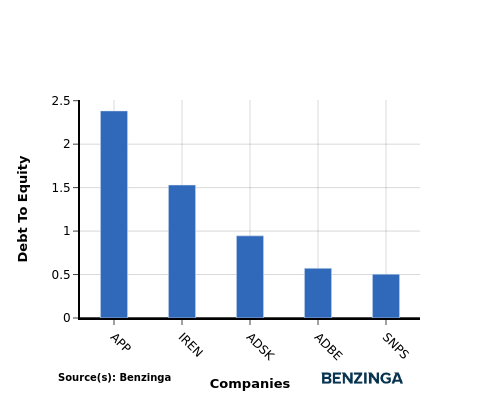
When evaluating Adobe alongside its top 4 peers in terms of the Debt-to-Equity ratio, the following insights arise:
-
Among its top 4 peers, Adobe is placed in the middle with a moderate debt-to-equity ratio of 0.57.
-
This implies a balanced financial structure, with a reasonable proportion of debt and equity.
Key Takeaways
For Adobe in the Software industry, the PE, PB, and PS ratios are low compared to peers, indicating potential undervaluation. On the other hand, Adobe’s high ROE, EBITDA, and gross profit suggest strong profitability and operational efficiency. However, the low revenue growth may raise concerns about future performance relative to industry peers.
This article was generated by Benzinga’s automated content engine and reviewed by an editor.