
In the dynamic and fiercely competitive business environment, conducting a thorough analysis of companies is crucial for investors and industry enthusiasts. In this article, we will perform an extensive industry comparison, evaluating Walmart (NASDAQ:WMT) in relation to its major competitors in the Consumer Staples Distribution & Retail industry. By closely examining crucial financial metrics, market position, and growth prospects, we aim to offer valuable insights for investors and shed light on company’s performance within the industry.
Walmart Background
Since its founding in 1962, Walmart has become the world’s largest retailer, operating over 10,700 stores globally (including 4,600 namesake locations on its home turf and another 600 Sam’s Club outlets) and growing its e-commerce presence, attracting 270 million customers weekly. In aggregate, the firm posted more than $680 billion in fiscal 2025 sales. Its core operations span three reporting segments: Walmart US (68% of fiscal 2025 sales), Walmart International (18%), and Sam’s Club (14%). Within the US, nearly 60% of its $465 billion in fiscal 2025 revenue came from its grocery offerings, with another quarter from general merchandise. Internationally, Walmart’s operations are concentrated in Mexico, though it also has budding exposure to India.
| Company | P/E | P/B | P/S | ROE | EBITDA (in billions) | Gross Profit (in billions) | Revenue Growth |
|---|---|---|---|---|---|---|---|
| Walmart Inc | 41.51 | 9.85 | 1.36 | 6.6% | $12.48 | $44.79 | 5.84% |
| Costco Wholesale Corp | 51.65 | 14.12 | 1.53 | 6.73% | $3.21 | $8.8 | 8.3% |
| Target Corp | 13.25 | 3.19 | 0.47 | 4.46% | $1.75 | $7.13 | -1.55% |
| Dollar General Corp | 25.32 | 3.94 | 0.77 | 3.49% | $0.69 | $3.18 | 4.58% |
| Dollar Tree Inc | 25.39 | 7.69 | 1.49 | 6.92% | $0.51 | $1.71 | 9.44% |
| BJ’s Wholesale Club Holdings Inc | 21.24 | 5.55 | 0.58 | 7.12% | $0.29 | $1.01 | 4.88% |
| Pricesmart Inc | 28.74 | 3.33 | 0.79 | 3.05% | $0.08 | $0.24 | 9.92% |
| Average | 27.6 | 6.3 | 0.94 | 5.3% | $1.09 | $3.68 | 5.93% |
After examining Walmart, the following trends can be inferred:
-
Notably, the current Price to Earnings ratio for this stock, 41.51, is 1.5x above the industry norm, reflecting a higher valuation relative to the industry.
-
It could be trading at a premium in relation to its book value, as indicated by its Price to Book ratio of 9.85 which exceeds the industry average by 1.56x.
-
The stock’s relatively high Price to Sales ratio of 1.36, surpassing the industry average by 1.45x, may indicate an aspect of overvaluation in terms of sales performance.
-
The company has a higher Return on Equity (ROE) of 6.6%, which is 1.3% above the industry average. This suggests efficient use of equity to generate profits and demonstrates profitability and growth potential.
-
The company exhibits higher Earnings Before Interest, Taxes, Depreciation, and Amortization (EBITDA) of $12.48 Billion, which is 11.45x above the industry average, implying stronger profitability and robust cash flow generation.
-
Compared to its industry, the company has higher gross profit of $44.79 Billion, which indicates 12.17x above the industry average, indicating stronger profitability and higher earnings from its core operations.
-
The company is witnessing a substantial decline in revenue growth, with a rate of 5.84% compared to the industry average of 5.93%, which indicates a challenging sales environment.
Debt To Equity Ratio
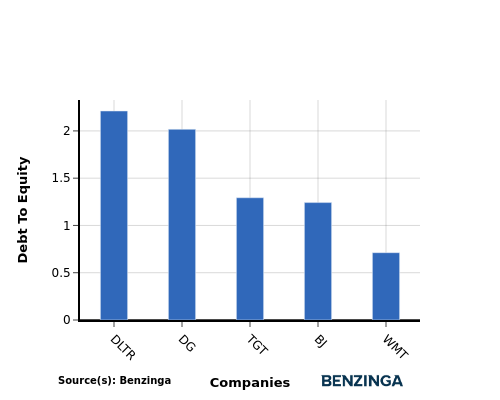
The debt-to-equity (D/E) ratio assesses the extent to which a company relies on borrowed funds compared to its equity.
Considering the debt-to-equity ratio in industry comparisons allows for a concise evaluation of a company’s financial health and risk profile, aiding in informed decision-making.
When assessing Walmart against its top 4 peers using the Debt-to-Equity ratio, the following comparisons can be made:
-
When comparing the debt-to-equity ratio, Walmart is in a stronger financial position compared to its top 4 peers.
-
The company has a lower level of debt relative to its equity, indicating a more favorable balance between the two with a lower debt-to-equity ratio of 0.71.
Key Takeaways
For Walmart, the PE, PB, and PS ratios are all high compared to its peers in the Consumer Staples Distribution & Retail industry, indicating that the stock may be overvalued. On the other hand, Walmart’s high ROE, EBITDA, and gross profit suggest strong profitability and operational efficiency relative to its industry peers. However, the low revenue growth rate implies that Walmart may be facing challenges in expanding its top line compared to competitors in the sector.
This article was generated by Benzinga’s automated content engine and reviewed by an editor.