Twenty-one days into the Iran conflict, markets are no longer processing a shock — they are rewriting the record books.
Moves are unfolding simultaneously across every major asset class, at a pace rarely seen in decades — and in some cases, never before.
This is not just an oil story. It is a full-spectrum energy shock, rippling through commodities, equities and bonds — a systemic repricing compressing into a matter of weeks.
Taken together, these moves signal something far bigger than a geopolitical event.
They point to a real-time shift in the macro regime.
Seven charts tell the story.
1) Brent Crude Oil: Strongest Monthly Surge Since November 1973
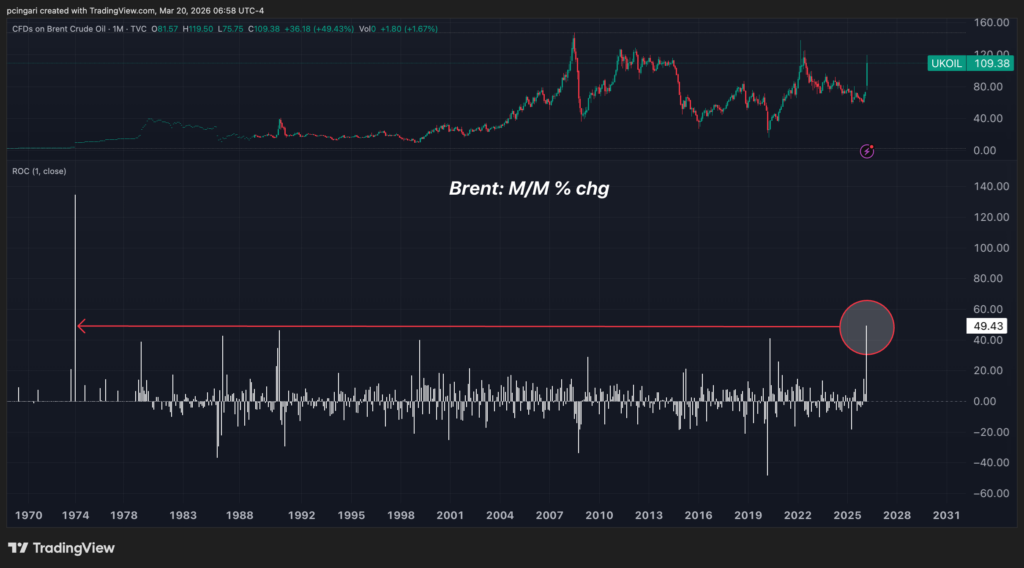
Brent crude – as closely tracked by the United States Brent Oil Fund LP, ETF (NYSE:BNO) – has surged 49% in March — the strongest monthly move since November 1973, when the Arab oil embargo sent shockwaves through a global economy that had never seen anything like it.
That embargo defined an era: it triggered a recession, forced the U.S. off its postwar energy assumptions, and reshaped geopolitics for a generation.
March 2026 is now in the same company.
The Strait of Hormuz, through which roughly 20% of the world’s traded oil passes each day, has effectively become a chokepoint under military threat.
Triple-digit Brent is not just an energy story. It is a cost-of-everything story.
Every good that moves by truck, every farm that runs on diesel, every factory that consumes petrochemicals has just had its cost structure repriced — in a matter of weeks.
2) New York Harbor Ultra-Low Sulphur Diesel Futures: Largest Monthly Increase EVER Recorded
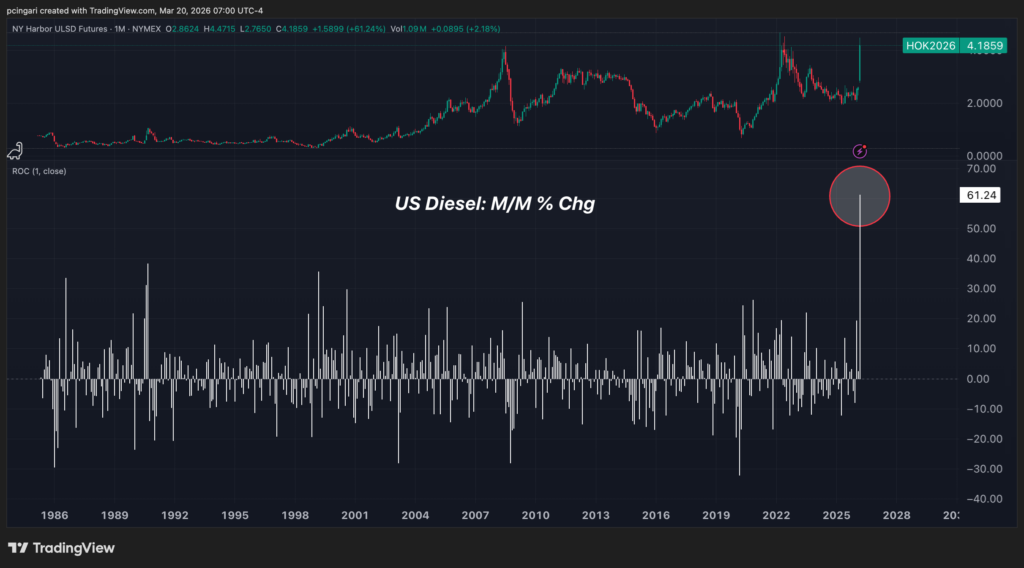
If Brent’s move is historic, Diesel’s is unprecedented. NY Harbor ULSD futures are up 61% month-to-date — the largest monthly increase in the history of the contract, dwarfing every prior spike, including 2022’s Russian invasion surge and the 2008 commodity supercycle peak.
Diesel is the transmission mechanism for everything that follows. It powers 70% of the freight that moves goods across the United States.
It fuels the tractors that plant and harvest food. It heats homes across the Northeast as heating oil. There is no physical good in the American supply chain that does not carry embedded diesel cost — and that cost just rose 61% in a single month.
The AAA national average for retail diesel now stands at $5.099 per gallon, up from $3.677 last month.
Read also: Trump Meets Diesel Shock: This Scary Chart Shows Inflation Hitting 8%
3) Gasoline Futures (RBOB): Biggest Monthly Surge Since March 1999
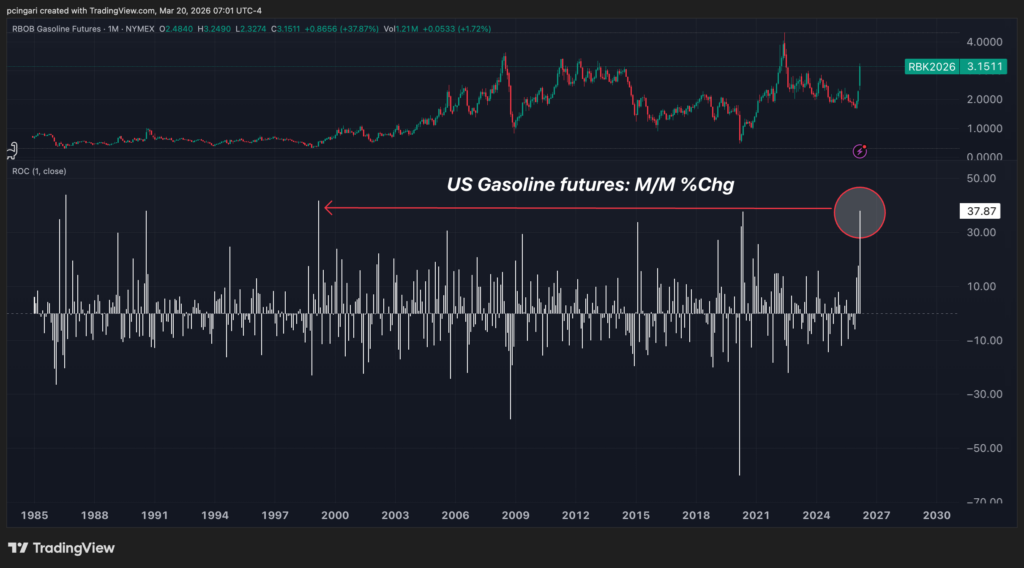
Gasoline futures — the benchmark for what Americans pay at the pump — are up 38% month-to-date, the largest monthly jump since March 1999.
That month, OPEC’s surprise production cuts ended a period of sustained low oil prices and triggered a sharp rally.
For the average American household, the pump is the most visible and politically charged expression of the energy shock.
At current RBOB levels, the potential of retail gasoline prices rising above $4.50 nationally could be a matter of days, not months.
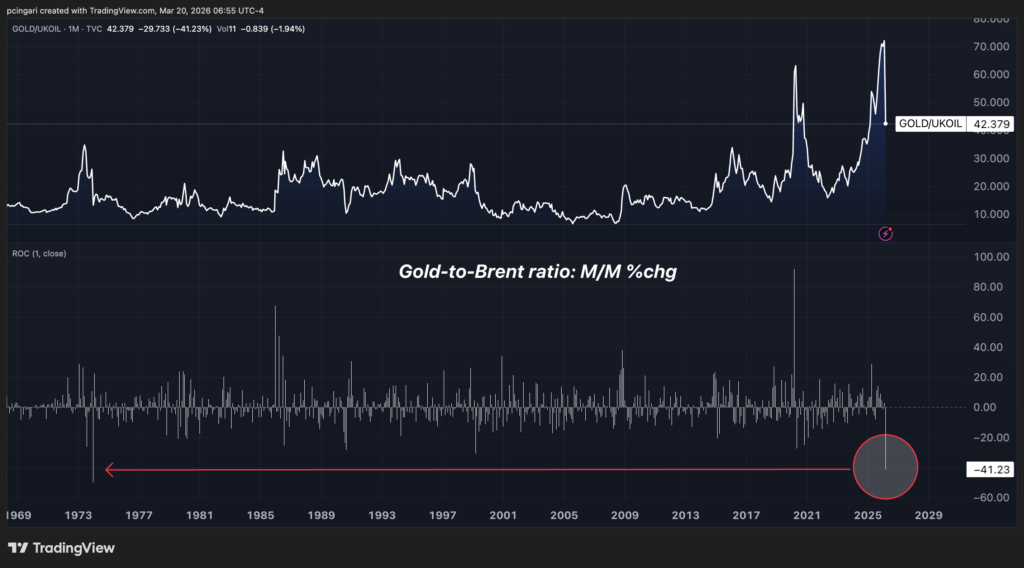
4) Gold-to-Brent Ratio: Worst Monthly Drop Since 1973
The gold-to-Brent ratio has collapsed 41% in March — its worst monthly reading since January 1974, at the height of the Arab oil embargo.
The ratio is being crushed from both sides. Oil is surging on one end, and the growing risk that the inflation wave it triggers will end central bank easing — and potentially force rate hikes — on the other, removing the very tailwind that had driven gold to record highs.
Gold prices have fallen 12% in absolute terms since the start of the war, the worst possible advertisement for the oldest crisis hedge in the playbook.
This is having a direct impact on gold mining stocks. The VanEck Gold Miners ETF (NYSE:GDX) has crashed 29% month-to-date, on pace for its worst monthly decline since October 2008 – at the onset of the Lehman crisis.
Read also: Gold Eyes Worst Month Against Oil Since 1973; Mining Stocks Slump Most Since 2008
5) Silver-to-Brent Ratio: Worst Monthly Drop Since 1980
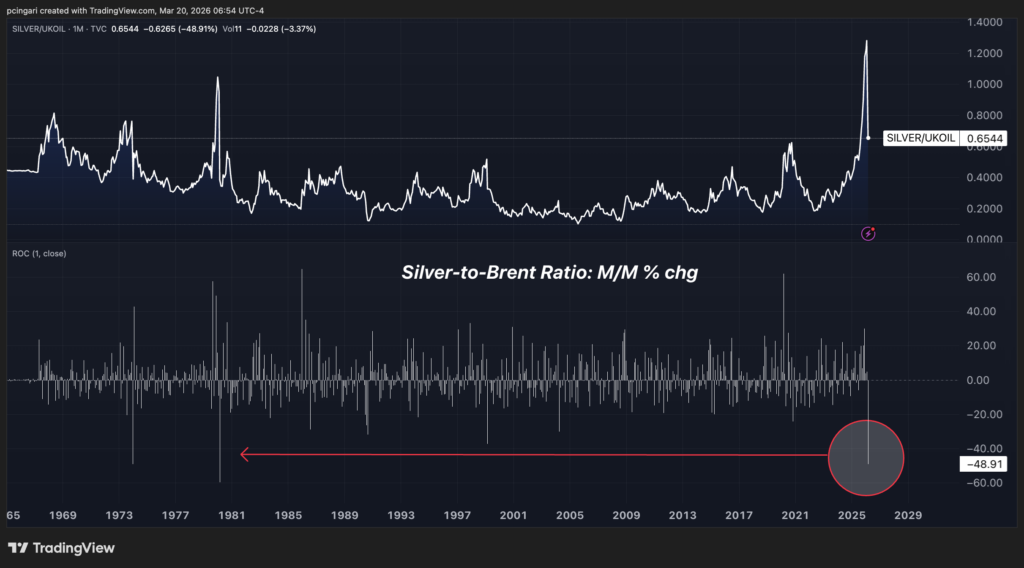
Silver entered 2026 as the hottest market on the planet — having just posted its best annual performance since 1979, driven by stabilizing inflation and aggressive market pricing of rate cuts ahead.
Twenty days of war have dismantled the entire silver’s bullish thesis.
The silver-to-Brent ratio has collapsed 49% in March — on pace for its worst monthly reading since April 1980, the month the Hunt Brothers’ silver bubble imploded.
Then as now, silver didn’t fail on its own merits — it was destroyed by a sudden macro reversal: in 1980, the Volcker shock; in 2026, an oil-driven inflation surge that has transformed rate-cut expectations into a liability.
Silver is down 23% in absolute terms month-to-date — its worst month since 2011.
6) The Refiner-Airline Performance Spread Has Never Been This Wide
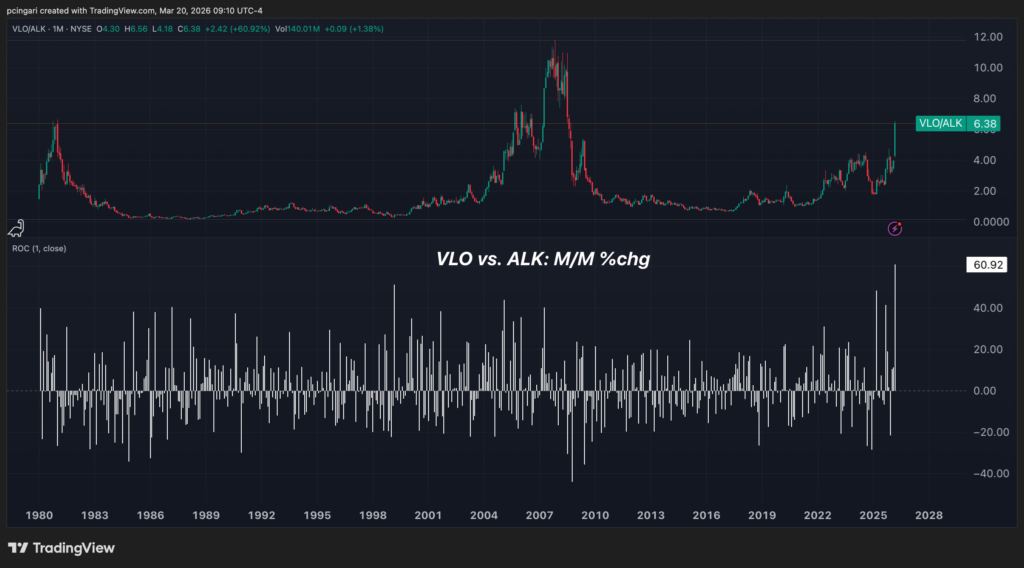
The equity market is also voting on the shock through one of the most visceral relative trades in the entire energy complex: refiners versus airlines.
Valero Energy Corp. (NYSE:VLO) relative to Alaska Air Group Inc. (NYSE:ALK) has surged 60.92% month-to-date — the largest monthly move in the ratio’s entire recorded history, stretching back to 1980.
The logic is brutal in its simplicity: Valero processes the crude that is surging in price and captures the margin between raw oil and refined products; Alaska burns the jet fuel that is the direct output of that same crude, with no ability to pass costs through immediately and no hedge large enough to absorb a 60% monthly spike in its primary input.
One side of this trade is expected to print record profits. The other is watching its cost structure detonate in real time.
7) UK 2-Year Bond Yields: Largest Monthly Spike Since September 2022
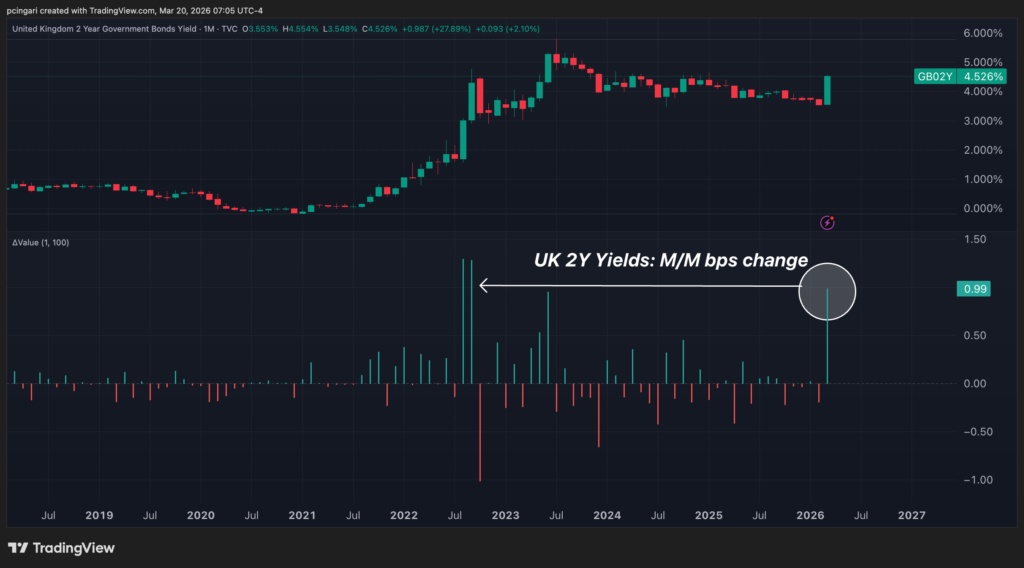
UK 2-year gilt yields have surged nearly 99 basis points in March — the largest monthly spike since the Liz Truss mini-budget shock of September 2022, which triggered an emergency Bank of England intervention, forced pension funds to liquidate gilts at distressed prices, and ended a government in 44 days.
The parallel is instructive. The Truss shock was a credibility crisis — markets lost confidence in UK fiscal discipline overnight. The current move is a different kind of crisis: markets are losing confidence that central banks can contain supply-side inflation that monetary policy cannot easily fix.
Short-dated sovereign yields are the bond market’s most direct expression of near-term rate expectations. A 99-basis-point move in a month is the market saying, explicitly, that the easing cycle is over — and that the next move may be a hike.
The probability of a Federal Reserve rate hike in 2026 has already doubled to 18% – according to Polymarket – from a pre-conflict baseline of roughly 8%.
Zero rate cuts are now the single most likely Fed outcome for the year, at 34% probability — up from just 9% before the war began.
The bond market is not whispering about rate hikes anymore — it is screaming.
Is This A Shock Or A Regime Change?
The instinct in financial markets is to assume mean reversion. Shocks resolve. Chokepoints reopen. Prices normalize.
That instinct has been broadly correct for every energy disruption since the 1970s — though each took longer to unwind than the initial consensus expected.
The current episode has three characteristics that distinguish it from prior shocks and complicate the case for rapid normalization.
The scale is without precedent in modern data.
Diesel posting its largest monthly increase in recorded history is not a blip — it is a deep repricing of the global supply chain.
Supply chains do not snap back cleanly.
Cost increases embedded in freight rates, food production, and industrial inputs will persist for months even if Hormuz reopens tomorrow.
Photo: PeopleImages/Shutterstock